A safety percentage is the end of a counting process. Before it appears in a chart, someone must decide what qualifies for the category, whose records belong in the calculation and how long observation continues. Reading the number without those decisions can turn a precise calculation into an answer to the wrong question. This guide follows that counting process and develops practical ways to inspect it.
The figure provides the clinical observations. The worked examples below are explicitly fictional and nonclinical: they explain the mathematics of combined categories without inventing additional patient results. Our editorial question is what information survives when detailed records become a summary. That question also helps separate a treatment outcome from a claim about a particular product, service or place of manufacture.
Reading the evidence
- Start with the field name
- Keep the measured category attached to every number copied from it.
Sources: Rubino 2025
- Combined does not mean separated
- A total for either of two conditions does not reveal their individual totals or overlap.
Sources: Rubino 2025
- Choose the counting unit
- Affected people, repeated episodes and observation time answer different questions.
Sources: Rubino 2025
- Retain the denominator
- A count needs its eligible comparison group before it becomes a proportion.
Sources: Rubino 2025
- Ask for the relevant record
- Evidence about an outcome and documentation of product origin require separate questions.
Sources: Rubino 2025
A combined category cannot identify its components without additional records.
These participant counts are not counts of episodes, hospitalizations or deaths.
Sources: Rubino 2025
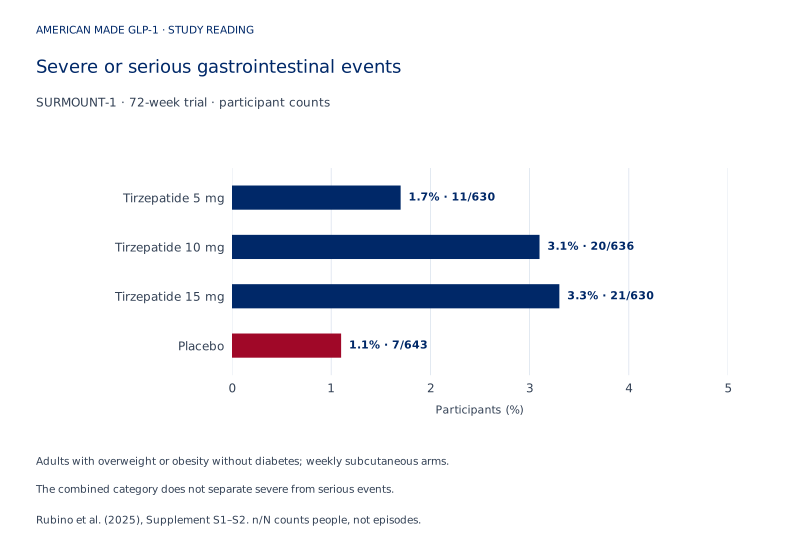
| Historical weekly arm | Participants, n/N | Reported percentage |
|---|---|---|
| Tirzepatide 5 mg | 11/630 | 1.7% |
| Tirzepatide 10 mg | 20/636 | 3.1% |
| Tirzepatide 15 mg | 21/630 | 3.3% |
| Placebo | 7/643 | 1.1% |
Locate the observation before interpreting it
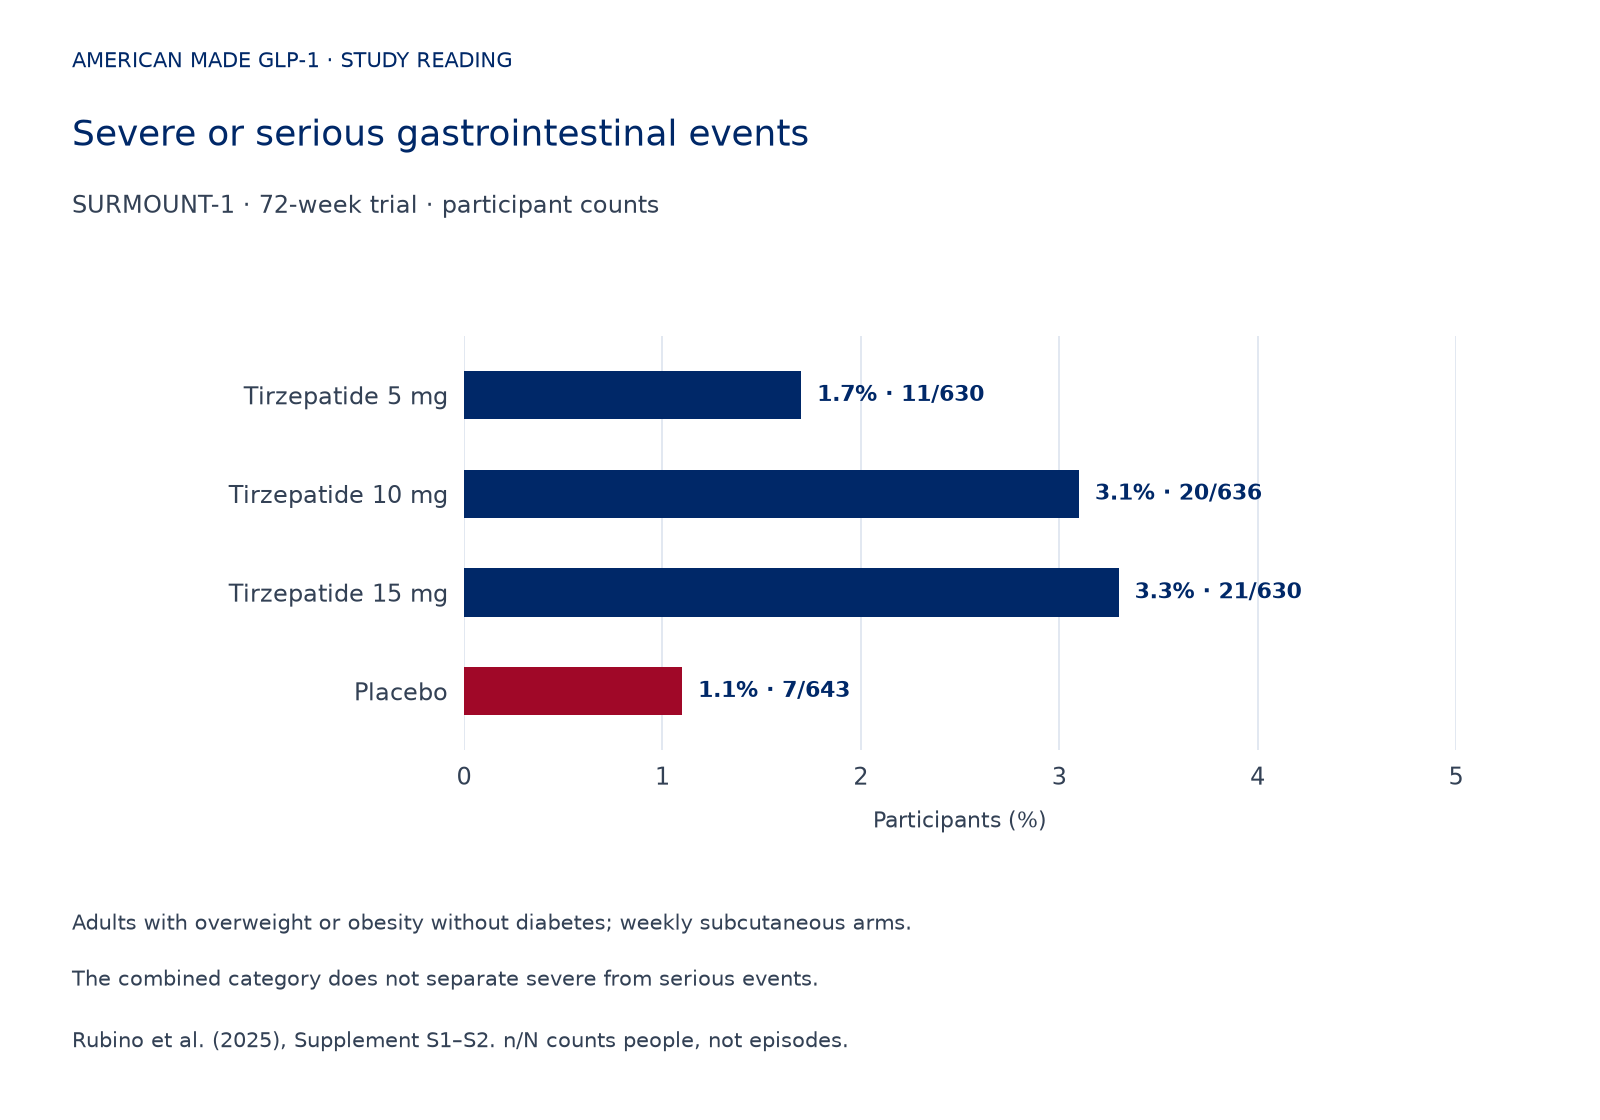
Rubino’s post hoc analysis included randomized trials in adults with overweight or obesity. Clinically significant gastric-emptying abnormalities and pancreatitis history were excluded. Gastrointestinal events sometimes led to treatment discontinuation. Eli Lilly funded the analysis; six authors were company employees and shareholders. Symptom groups were not randomized.
Read the displayed category as a complete measurement statement. Its name, arm labels, denominator and time window belong together. A shorter replacement heading may sound easier, yet remove the distinction that makes the count interpretable. In an evidence notebook, copy the field name before writing a conclusion, then list the additional information that conclusion would require. This makes an unsupported step visible instead of hiding it inside familiar language.
A useful reading sequence moves from record to question: identify what was counted, describe the comparison, and only then consider an explanation. The companion guide to follow-up and continued treatment develops another counting distinction. Comparing those reasoning methods does not require combining their data or treating one result as a test of the other. Each table retains its own meaning.
Sources: Rubino 2025
Understand overlap with a fictional equipment register
Imagine a fictional inspection of equipment, unrelated to medicines. Four units have high-intensity alarms and three require escalation to a supervisor. Two units appear in both groups. If the question is how many units meet either condition, adding four and three counts those two shared units twice. Subtract the overlap once: four plus three minus two equals five distinct affected units.
That arithmetic distinguishes a union from a sum of separate categories. A union includes each qualifying unit once, even when it satisfies both conditions. The separate category totals remain useful, but they answer different questions. A reader who wants to know the work required by supervisors needs the escalation count; a reader who wants the reach of either warning needs the union.
The fictional labels are deliberately nonclinical. They do not define medical severity or seriousness, or assign either status to anyone in the study. Their purpose is to expose the missing relationship: knowing that categories may overlap is different from knowing how much they overlap. A diagram with two circles can express that relationship, but drawing specific areas would require actual component records. Attractive geometry cannot supply the missing observations.
Sources: Rubino 2025
See why one total permits several underlying stories
Consider a second fictional example: a catalog contains twelve items, five of which satisfy condition A or condition B. One possible allocation puts all five in A and none in B. Another puts two in A and three in B, with no overlap. A third places four in A and three in B, with two shared. All three allocations produce the same combined total.
This is an identification problem. A quantity is identifiable from a summary when that summary pins down its value. Here, the union is known by construction, while the components are not. More arithmetic applied to the same total will not select the correct allocation. Additional observations must distinguish the possibilities. The table records alternatives, not competing estimates of any clinical finding.
A useful next request would therefore seek a component cross-tabulation: A only, B only, both and neither, all within one clearly defined population. Those mutually exclusive cells could reconstruct the separate totals and their union. Until such records are available, choosing one allocation because it feels plausible adds an assumption. The assumption should remain visible, rather than being reported as something the combined number revealed.
| Invented allocation | Items meeting A or B | What remains different |
|---|---|---|
| A only: 5; B only: 0; both: 0 | 5 | All flagged items belong only to A |
| A only: 2; B only: 3; both: 0 | 5 | The two categories do not overlap |
| A only: 2; B only: 1; both: 2 | 5 | Some items satisfy both conditions |
Sources: Rubino 2025
Separate affected units from repeated episodes
Now imagine a fictional maintenance register with three machines. One produces one alert, another produces two, and the third produces four. The register contains seven alerts but only three machines with an alert. Neither count is a correction of the other. They describe different features: how many machines were affected and how many alert records occurred.
The same distinction matters whenever a summary counts whether something happened at least once. That yes-or-no indicator discards the recurrence pattern. A machine with one alert and a machine with several both contribute one affected machine. To reconstruct episode frequency, a reader would need event-level records, rules for separating episodes and a way to connect repeated entries to the same unit.
An additional classification, such as whether an alert triggered a service visit, would require another field. It cannot be inferred from the existence of an alert alone. This is a general record-reading rule, not a claim about the equipment example’s reliability or a translation into clinical outcomes. When evaluating a summary, write the desired outcome beside the outcome actually counted. If they differ, ask which missing field would connect them.
Sources: Rubino 2025
Keep the denominator beside the numerator
In a fictional archive, four flagged records among eighty amount to five percent. In another archive, six flagged records among two hundred amount to three percent. The second archive has more flags but a smaller proportion. Raw counts and proportions are both accurate in this example; the apparent contradiction disappears when their denominators are restored.
A denominator is a membership decision, not merely a number underneath a fraction. It specifies which records were eligible to contribute to the numerator. Mixing a numerator from one population with a denominator from another creates a new quantity that neither original summary reported. Even if the resulting percentage looks reasonable, plausibility is not evidence that the membership rules match.
For a real table, inspect the denominator’s description before comparing the lengths of bars. Ask whether each numerator was collected from the same people represented in its denominator, under the same observation rule. Our guide to pills, injections and formulation offers a related place to organize product-identity questions. A familiar ingredient name should not silently replace the more specific identity attached to an evidence record.
Sources: Rubino 2025
Distinguish a fixed-window proportion from timing
Suppose a fictional sensor report marks each device according to whether it was ever flagged during an inspection period. One set of flags could appear near the beginning, another near the end, yet both reports could have the same number of ever-flagged devices. The endpoint total alone does not reveal the sequence. A timeline would need dates, rather than a more elaborate display of the same total.
A rate based on observation time asks a different question again. Its denominator measures accumulated time under observation, while a fixed-window proportion uses a count of units. Dividing a proportion by the nominal length of a study does not automatically create a valid rate. That shortcut assumes information about observation and event counting that the proportion may not preserve.
The practical reading task is to name the time question first. Are you asking when events began, whether they recurred, or how many units were affected by the endpoint? Each question suggests a different record structure. A dated event log, a recurrence history and an endpoint indicator are not interchangeable exports. Recognizing that difference helps identify the next useful dataset without manufacturing a time pattern from a static chart.
Sources: Rubino 2025
Build a small dictionary before comparing sources
Two tables can use similar language while organizing different records. Before comparing them, construct a small dictionary of the fields that give each number its meaning. Record the category definition, counted unit, population membership, observation window and aggregation rule. This is more informative than placing two percentages beside one another and asking why they differ.
The dictionary should include what is unknown. An empty entry means the comparison needs clarification; it is not permission to borrow a definition from the other table. Matching labels are only a starting point. Conversely, different headings do not prove an inconsistency if the underlying questions differ. First establish whether a like-for-like comparison is possible, then decide what calculation would answer it.
Product descriptions deserve the same discipline. The formulation guide can help structure the identity questions, while the guide to made-in-USA claims provides a separate place to examine what an origin statement is asserting. These are organizing aids. A clinical measurement dictionary and an origin-document checklist should remain distinct even when they concern the same named ingredient.
| Field to record | Difference to check | Why it matters |
|---|---|---|
| Category | One condition or a combined category | The numerator may answer a different question |
| Counting unit | People, episodes or observation time | The quantities are not interchangeable |
| Population | Which records qualify for inclusion | Membership determines the denominator |
| Observation window | Start, end and follow-up rules | The opportunity to record an event can differ |
| Aggregation | Single study or a pooled collection | A shared label may hide a different grouping |
Sources: Rubino 2025
Separate missing information from an observed absence
A blank component field and a recorded zero are different pieces of information. A zero says that the measurement process returned no qualifying observations within its stated scope. A blank may mean the field was not reported, not collected or unavailable to the reader. Treating both as zero turns an information gap into a result.
Selection and measurement introduce different questions. Selection concerns which records enter the analysis; measurement concerns how those records acquire a category. For an imagined register, limiting entry to units that complete inspection changes membership. Changing the wording of the inspection question changes ascertainment. Either alteration could affect the summary, but the direction and size would require evidence. Naming a possible influence does not establish that it explains an observed difference.
Random assignment, where present, also needs a named target. It can establish how treatment groups were formed without randomizing every later characteristic. Grouping records after an event occurs answers another question and may create groups that differ in additional ways. A careful reader asks which comparison was assigned in advance and which was constructed afterward. That distinction guards against treating a descriptive association as if it were a separately randomized experiment.
Sources: Rubino 2025
Match a commercial question to its own documentation
Our editorial interpretation is that a scientific outcome and a product-origin assertion require different chains of support. To evaluate an origin statement, first specify the particular product, the production step and the period being claimed. Then ask which record connects that item to that step. A clinical outcome table does not become such a record merely because the publication names a company.
The made-in-USA claims guide is a starting point for framing those questions. For a service comparison, the Ro review can serve as a place to organize questions about written product and care terms. The Mochi Health review can be used in the same documentary way. These links do not establish that either service supplies the study product, reproduces its results or has a verified manufacturing chain.
Keep the evidence request narrow enough to answer. Instead of asking whether a service is generally backed by science, ask which exact statement needs support and what document would support it. This separates evidence about an ingredient, a formulation, an observed outcome and a current transaction. The result is a more useful comparison because unresolved questions remain attached to specific claims rather than disappearing inside a broad endorsement.
Sources: Rubino 2025
Use current safety information for current clinical questions
Current ZEPBOUND labeling uses a separate, two-trial severe-GI pool. Contraindications include personal or family medullary thyroid carcinoma, multiple endocrine neoplasia type 2 and serious hypersensitivity. Human thyroid-tumor risk remains uncertain. Warnings include pancreatitis, gallbladder disease, dehydration-related kidney injury and severe gastrointestinal reactions; use is not recommended with severe gastroparesis. Severe or persistent symptoms warrant clinician contact; persistent severe abdominal pain needs prompt assessment. Inform the procedural team before anesthesia rather than deriving a withholding schedule from trial data.
The analytical lesson is to keep a historical observation separate from a present decision. A table can help explain how evidence was summarized without providing all the information needed to assess an individual. Clinical questions require the appropriate current information and professional assessment; arithmetic performed on a published row does not replace either.
For research reading, finish with a specific unresolved question. If the question concerns recurrence, request event histories. If it concerns the components of a combined category, request their cross-tabulation. If it concerns a product, request product-specific documentation. This turns uncertainty into a concrete information request while preserving the boundaries of the observation already available.
Sources: Zepbound label; Rubino 2025
Questions about the evidence
Why preserve a long category name when a shorter one sounds clearer?
The name can carry a distinction that changes which records qualify. Shorten explanatory prose around it, but retain the measured field when presenting its result. A clearer sentence should make the relationship easier to follow without replacing the question the original count answered.
Sources: Rubino 2025
Can an affected-person total reveal how many episodes occurred?
Only additional event records could establish that. A yes-or-no indicator retains whether a person qualified, not how often. To answer the recurrence question, look for episode definitions, repeated-event dates and a reliable link between each event and the same individual.
Sources: Rubino 2025
What should I check first when two percentages appear different?
Check the numerator definition and denominator membership together, then the counting unit and observation window. A numerical difference is interpretable only after those fields are understood. Matching the fields does not itself explain the difference; it establishes which comparisons are meaningful.
Sources: Rubino 2025
Does an unavailable component count mean that component never occurred?
No. Unavailable information and an observed absence are distinct states. Keep the missing field marked as unknown and identify the record needed to resolve it. Assigning a zero would add a claim that the absence of a reported number does not support.
Sources: Rubino 2025
What would connect a research claim to a particular product?
Begin with the exact claim and identify the product, formulation and relevant documentation. Then ask whether the evidence actually addresses that combination. Similar names can help locate records, but resemblance alone does not establish a documented connection between a clinical observation and a current product.
Sources: Rubino 2025
Editorial assessment
The most productive next step is to preserve the measured quantity and request the information needed for the next question. A component cross-tabulation would address overlap; event histories would address recurrence and timing; explicit membership rules would clarify a denominator. Product-origin questions require their own documentary connection. None of those records can be recovered simply by redrawing a combined total. Reading in this order makes the existing evidence useful while keeping a new assumption from quietly becoming a new finding.
Sources and access
- Gastrointestinal tolerability of once-weekly semaglutide 2.4 mg in adults with overweight or obesity, and the relationship between gastrointestinal adverse events and weight loss.
Complete primary article XML inspected; focused table cells checked in a derived rendering. Supplement retained but not used.
Checked 2026-10-26.
- Gastrointestinal tolerability and weight reduction associated with tirzepatide in adults with obesity or overweight with and without type 2 diabetes in the SURMOUNT-1 to -4 trials.
Complete primary article XML and official supplementary DOCX inspected. Table cells checked in derived renderings.
Checked 2026-10-26.
- DailyMed: WEGOVY semaglutide current prescribing information
Current official prescribing information inspected.
Checked 2026-10-26.
- DailyMed: ZEPBOUND tirzepatide current prescribing information
Current official prescribing information inspected.
Checked 2026-10-26.